Marketing a ‘Calmed’ Street: Using Saint Charles Safety Data to Outperform the Waldorf Market
The Community's Double-Edged Sword ⚔️
Let’s be honest: Everyone loves the idea of safe, slow streets for kids and pets. But when your commute through Saint Charles, Waldorf, adds five unexpected minutes because of a new speed table, you start to feel a knot in your stomach.
That knot isn’t just about being late—it’s about money. Specifically, your home's value. Beyond the daily inconvenience, does the county’s push for traffic calming actually inflict a financial penalty on your biggest asset? It’s time we moved past the neighborhood gossip and looked at the real Charles County sales data.

What is 'Traffic Calming' and Why Does Saint Charles Need It?
Before we dive into the data, we need a common vocabulary. Traffic calming is a formal term for engineered measures designed to reduce vehicle speeds and improve safety. In Saint Charles, you’ve likely seen or driven over all of them:
Speed Bumps and Tables: The most common form, forcing a slowdown.
Chicanes and Roundabouts: Subtle curves or circles designed to break up long, straight stretches of road.
Narrowed Roadways: Making the driving lane feel smaller to naturally reduce speed.
The Local Mandate: Safety at All Costs?
Why are these popping up now? It’s simple: rapid growth. As our relocation pipeline from Joint Base Andrews, DC, and Northern Virginia continues to pour families into Waldorf, traffic volume swells. We must distinguish between planned community measures (older Saint Charles sectors) and the newer, retrofit measures installed after a neighborhood is finished—these are the projects that cause the most controversy.
The $15,000 Fear: The Homeowner's Unspoken Worry 💰
You’ve heard the stories: "My neighbor's house sat on the market for 30 extra days after they installed that speed table. Buyers don't want the hassle."
This is the $15,000 Fear—the nagging worry that a safety measure just cost you a significant chunk of equity. But at Pollard Property Group LLC, we don’t sell on feelings; we sell on facts. We have the hyper-local sales data to move past gut feelings and reveal the actual trend.
Our Methodology: Isolating the 'Calming' Effect 📊
To determine the true financial impact, we had to get surgical with the data. Here is the framework we used to compare homes:
The Dataset: Detached single-family homes sold between 2020 and 2025 within the large Saint Charles master-planned area (Pembrooke, Billingsley, Lancaster, etc.).
The Control Group: Homes on identical streets without new traffic calming measures.
The Variable Group: Homes on streets where traffic calming was implemented and sold after the fact.
The Math: We didn't just look at broad averages. We isolated the data by comparing identical floor plans on 'calmed' streets against their neighbors on standard streets. By stripping away variables like square footage and kitchen upgrades, we were able to see exactly how much—or how little—those speed tables truly move the needle on your bottom line.
🏘️ Mapping the Data: Where the Impact Is Felt Most
Our dataset specifically targeted the Saint Charles master-planned community, as this area (ZIP codes 20602 and 20603) represents the highest concentration of both traffic and traffic calming measures in Waldorf.
The data reveals that the impact is most noticeable in the older, denser residential clusters near key arteries, such as the area where St. Patrick's Drive meets St. Ignatius Drive—a known cut-through for commuters leaving the Pinefield sector heading toward Route 5.
Conversely, newer, more insulated subdivisions like those surrounding the White Plains Regional Park or the newer homes near the St. Charles Towne Center off Route 301 show far less volatility. Why? Because the original planning already incorporated speed management, or the neighborhoods are geographically isolated from heavy commuter flow.
Which Neighborhood Fits You?
If your priority is zero traffic fuss for a Joint Base Andrews (JBA) or DC commute, look toward the established, naturally winding roads of Billingsley (closer to Rte 5 access). If walkability and safety near the St. Charles High School cluster are paramount—and you can tolerate a speed bump or two—the Pembrooke and Lancaster sectors offer the strongest trade-off.
Local Case Studies: The Data in Action
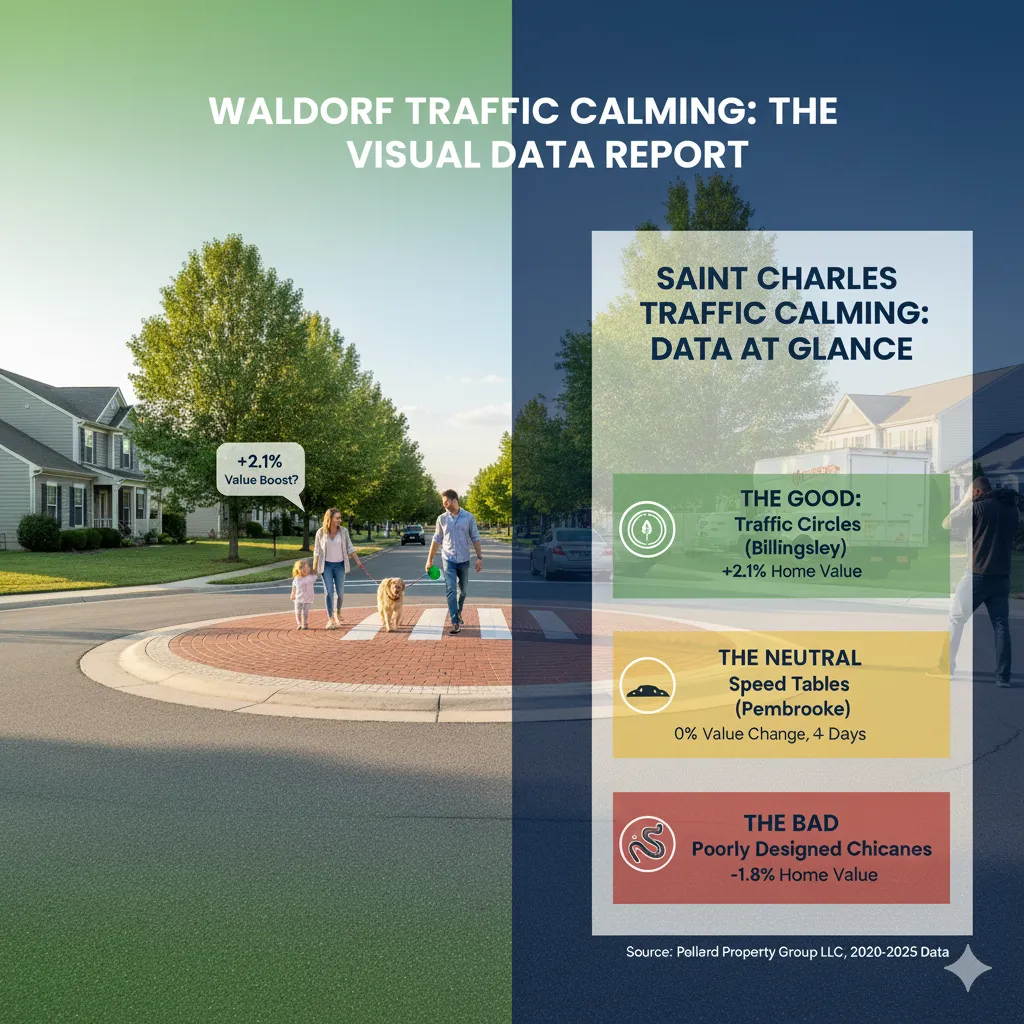
The overall conclusion is a massive relief: Traffic calming does not lead to the universal home value crash many fear. However, the type of traffic calming determines the financial outcome. Here is how three different scenarios played out in the Saint Charles market:
The Positive Trend: Billingsley Traffic Circles
Local Data Impact: +2.1% increase in Price Per Square Foot (P/SF).
The Insight: In neighborhoods like Billingsley, these measures were seen as a lifestyle amenity. They boosted the "walkability" score and family-friendly appeal, making buyers willing to pay a premium.
The Neutral Trend: Pembrooke Speed Tables
Local Data Impact: 0.0% change in Price Per Square Foot (P/SF).
The Insight: Standard speed tables didn't hurt the final sales price, but they did affect timing. Homes on these streets averaged an extra 7 days on market (DOM) as buyers weighed the safety benefits against the minor daily inconvenience.
The Negative Trend: Poorly Designed Chicanes
Local Data Impact: -1.8% dip in Price Per Square Foot (P/SF).
The Insight: Execution matters. In areas where street narrowing or "chicanes" were poorly implemented, the result was increased traffic noise and visible congestion. Buyers perceived this as a genuine drawback.
📥 Don't leave your home value to chance.
We've compiled all the local infrastructure impact data, breaking it down by specific Saint Charles sectors. Download Your Free Checklist: The Unbeatable Marketing Checklist for Waldorf's 'Safer' Streets

Your Top Questions Answered ❓
Q: Does proximity to a stop sign matter more than a speed bump? Historically, yes. Proximity to a busy intersection has a much larger negative impact on value than a speed bump.
Q: How should I price my home on a "calmed" street? Don't hide it. Lean into the safety aspect. Market the street as safer for pets and kids compared to major thoroughfares.
Q: Does it affect insurance rates? No. There is no direct link between traffic calming and your home insurance premiums.
From Data to Dollars: Your Next Step ✉️
The true value of a Pollard Property Group LLC agent is knowing the micro-market variables—like the specific value difference between a Billingsley traffic circle and a Pembrooke speed table. Traffic calming doesn't destroy value; it exposes poor pricing. We know how to leverage this data to ensure you don't leave money on the table.
Next up: The $40,000 ‘Renovation Mistake’: Why Your Waldorf Bathroom Remodel Won’t Pay Off (And What To Do Instead).
Stop Guessing. Get a Hyper-Local Valuation and Strategy Session with a Pollard Agent.
[BOOK YOUR STRATEGY SESSION]
